Introducing: Modern Spectrum Analyzer!

Accuracy, speed, novel signal analysis techniques with modern, user-friendly experience

SA01 Spectrum Analyzer provide unrivaled precision, exceptional low-level signal sensitivity, signal processing, fast real time display with persistence, all thru outstanding user experience, for cheap.

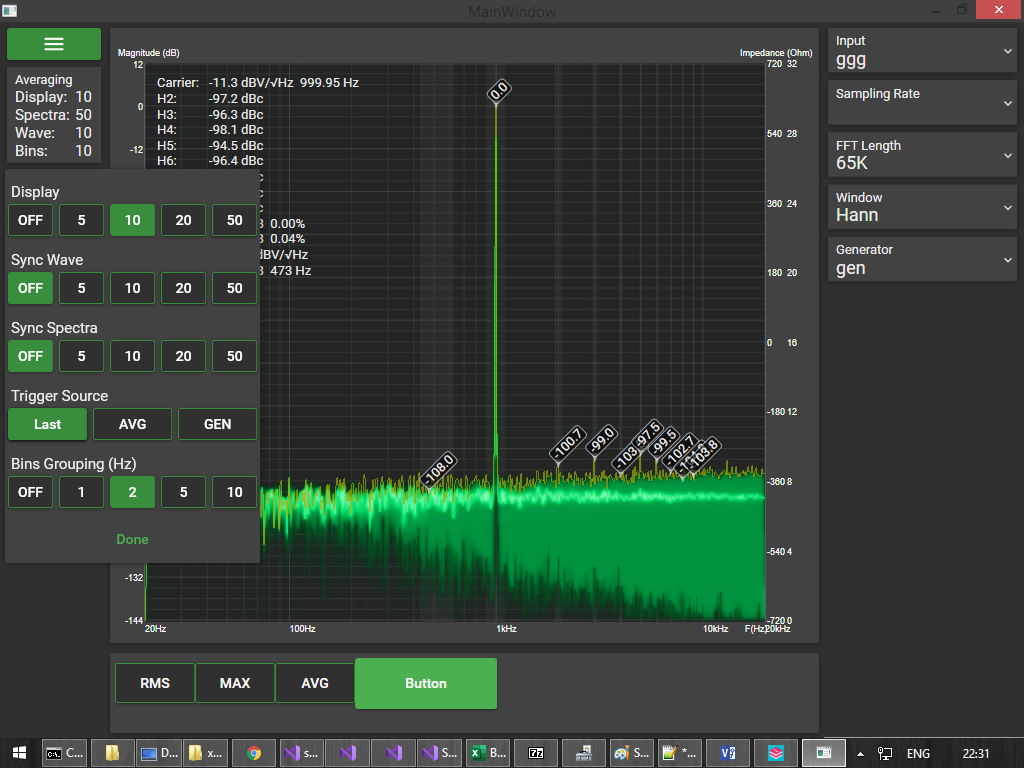
Experience the instrument-like user interface - where you don't need to dig into menus to toggle a mode, set a parameter or wonder have you checked that checkbox on "page 3" of settings. Every parameter is visible right away, as well as configurable within 1-2 touches.

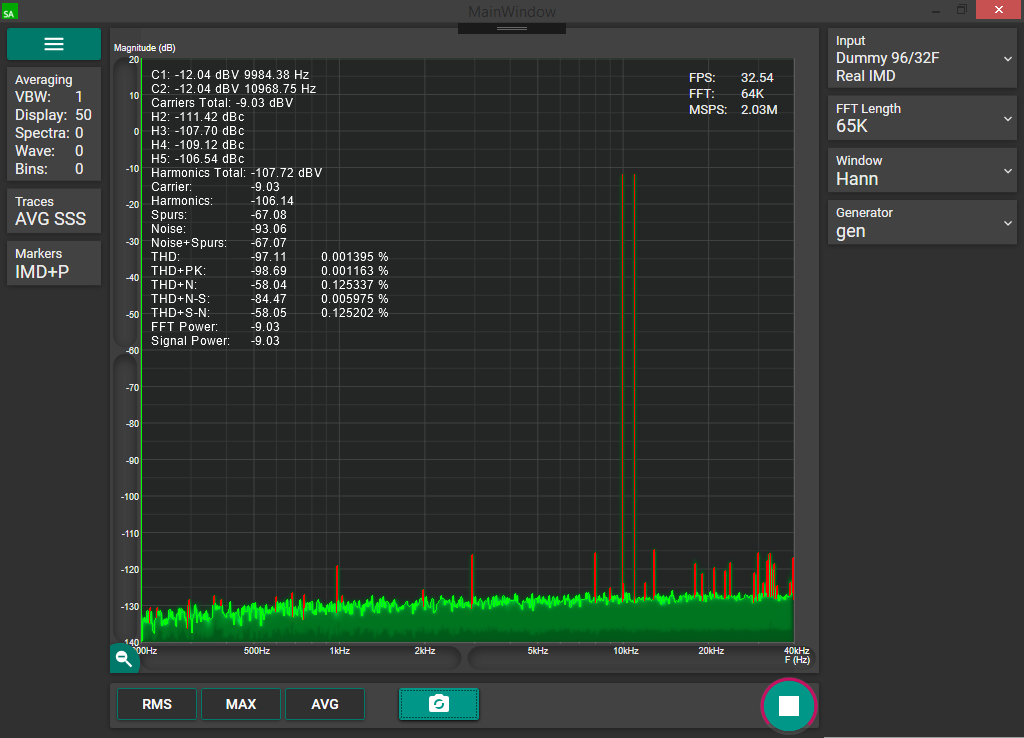
How low is your noise floor? We can make it 50dB better! From extremely long FFTs (16M samples, displayed at 10FPS, typically 24dB better than 65K FFT), thru actually working synchronous signal and vector averaging (get another 20dB improvement in seconds) and noise floor extension (yet another -7dB to your noise floor, really helps with precision of HD/IMD measurements).

Tired of waiting for the buffer to fill up to display your first measurement at longish FFTs? We've got you covered, with adaptive FFT window length - you get instant display with lower resolution, and it increases as the buffer fills up. No more waiting for entire measurement buffer fill-up only to find out it gone wrong.

And more, lots more. Try it yourself!


flash_on

Fast

Like, really fast. From screen refresh rate, thru measurement-to-screen time, even in measurement modes that typically can't allow it. No matter what, you'll see all the data as it comes, and faster. 

group

User Experience Focused

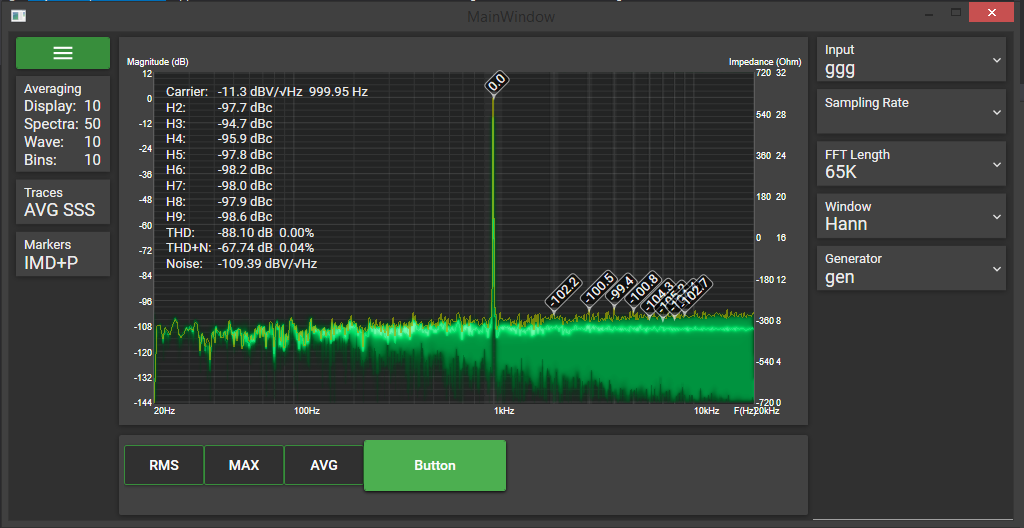
Touch friendly, instrument-like interface. It's not another "program". It's an instrument. A big, clean, and informative UI that lets you see and change every parameter of measurement. Analog and "digital" phosphor persistency modes, markers, zoom... Made to be touched, by you.

attach_money

Cost effective

And rather cheap :) Hardware ages, fails, loses relevance. Software is forever :) Software based analysis, with simple, dumb, freely available and replaceable digitizers - is the way to go in this constantly evolving world.
$50 for community and $300 for professional licences.  

Spectrum Analyzer Persistence phosphor IMD, THD, Phase Noise measurement configuration switching on the fly Phase noise density Analyzer average, cross-correlation modes Analyzer markers and cursors Touch friendly UI FFT windowing functions Intermodulation measurement

Features

The list grows on a daily basis. We are striving to produce precise, beautiful, snappy, intuitive experience as well as unrivaled precision and advancements in signal analysis.

  • Visual: Phosphor persistence mode - "analog" (mimics analog Spectrum Analyzer) and "digital" (heat-coded display).
  • Markers: drag'n'drop, easy add/remove, "auto markers" for THD carriers + harmonics, or for carriers in IMD mode.
  • Spurs detection and separation in measurements like in these costy signal analyzers
  • Nice touch-friendly UI, all the required info is clearly displayed, and is 2-or-less _touches_ away from being changed.
  • Screenshots! With all of the measurement parameters included.
  • Zoom! Selection-based, scroll wheel, dragging of sliders/axis
  • New: Channel math! Both in Time and Spectra domains, including transfer function and cross-correlation measurements! Now you could use it as vector network analyzer.
  • New: Scalloping loss compensation. Yet another 1-3dB of precision!
  • New: Phase Noise measurement mode
  • New: A big one, Very-Dynamic-Sample-Rate-Converter, phase locking of measurement sample rate to carrier = reduction of phase noise/wander, stable frequency over whole 16M FFT window, elimination of scalloping effects both for carrier and harmonics, coherent sampling and what not. As a by-product, decimation, phase noise simulation and simple ASRC too.

Input

We have implemented most of available I/O interfaces to ensure compatibility with any existing and forthcoming devices, operation systems and configurations:

  • MME
  • WASAPI Shared
  • WASAPI Exclusive
  • WASAPI Global Capture (captures the output stream of the sound card)
  • ASIO
  • Dummy - Built-in test data generator for self-checks and just to play/demonstrate different operation modes like harmonic, intermodulation distortion, phase noise and noise.

Averaging

A lot of effort has been made to ensure correct representation of signal, as well as diminishing the effects of noise on measured data. Synchronous averaging is exceptional in it's ability to de-noise the measured signal, typical gain is of 20dB under the noise floor.

  • VBW - pixel grouping - "put FFT point every N pixels". Spectra looks smoother, but with less horizontal resolution.
  • Display - averages between displayed data (power-wise and peak/minima-wise), reduces variance of measured data
  • Spectra - synchronous vector averaging. Reduces noise, typically 20dB
  • Wave - synchronous time-domain averaging, same as above but with waveform itself
  • Bins - "groups" bins together, spectra convolution by N-length "box" filter. Reduces scalloping errors

New: Redissue display of synchronous averaging methods - lets you see the difference (drift, phase noise and regular noise of signal), Output = Signal - AVG(Signal)

2-Channel Math

Time domain:

  • Average
  • L-R (virtual differential input)
  • L+R
  • L*R (for modulations and what not)

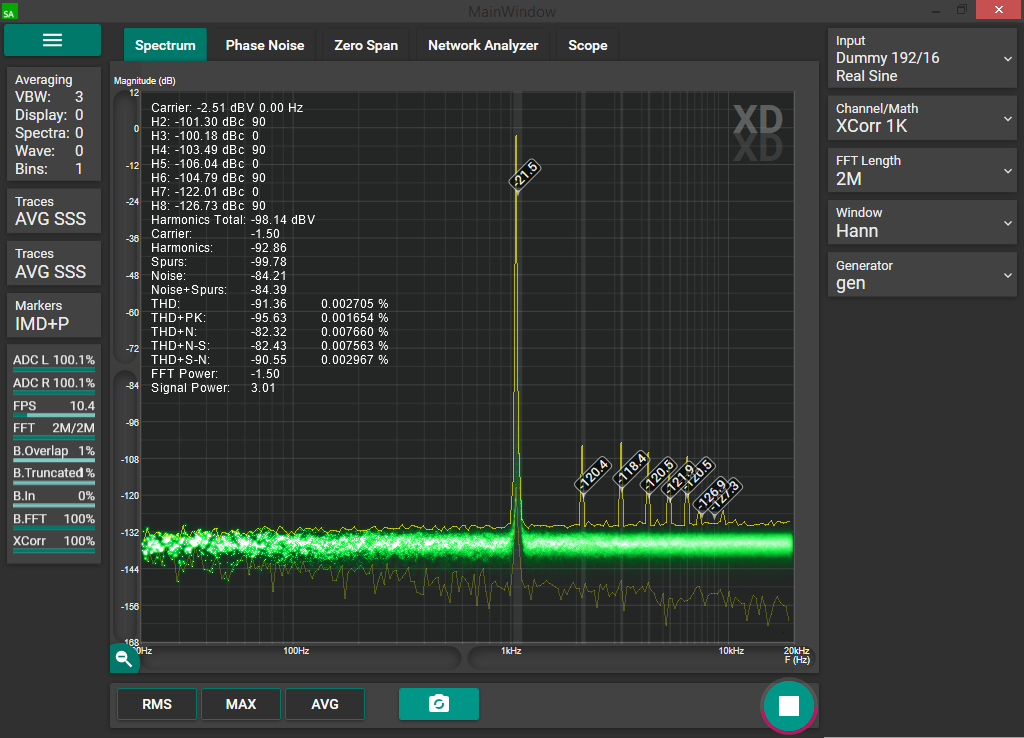
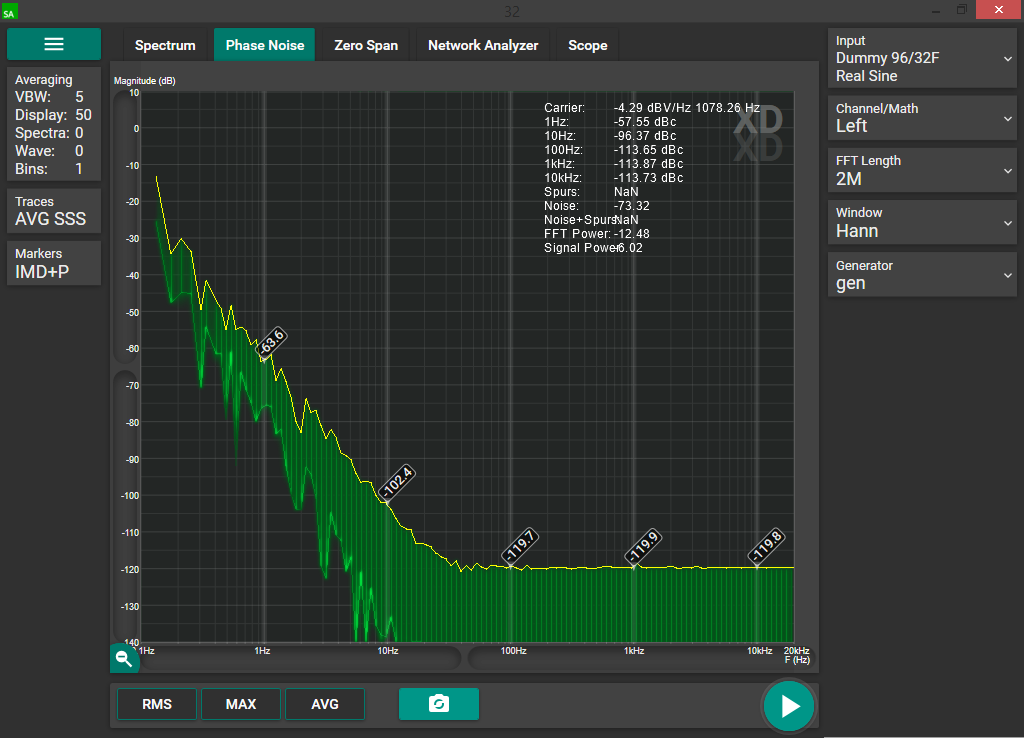
Frequency domain (both in scalar and vector modes!):

  • L*R
  • L/R, R/L - measurement of transfer function (vector network analyzer anyone?)
  • Average
  • Cross Correlation
  • Merge - merge of L and R responses together (for example, to put a carrier signal back into post-notch spectra, in real time).

Measurements

  • THD of all sorts + more
  • HD and their phase, both peak and power-channel method calculations
  • IMD (i'm unsure about the algorithm, i calc it as THD - ratios of summed power, carrier vs products, carrier vs products+noise), up to 5th product and 3 carriers
  • Actual noise floor in presence of measured signal

Compensations

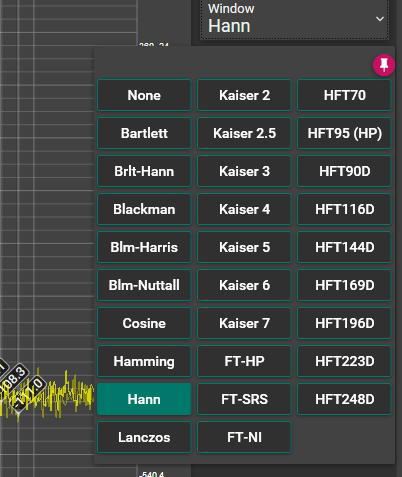
Compensation is a thing. Although FFT is supposed to produce exact display of underlying signal, it's output is never correct in presentation of noise, or in presence of windowing function.

  • Window type (ENBW)
  • FFT gain
  • RBW (PSD)
  • Noise Floor Extension
  • Scalloping Loss (when measured signal frequency falls between FFT bins, it could have up to 1.4dB error with Hann window, even more so with higher selectivity windows)

The measured parameters won't change with different FFT length, Fs and window types, only will gain extra precision.

Roadmap

We are in full-on development of the product, here is our To-Do list:

  •  Signal generator: Coherent measurements, pseudo-random noise synthesis, sweep, multitone synthesis...
  •  Cross-correlation: Done!
  •  Phase Noise measurement mode: Done!
  •  Support of extra hardware - high-MSPS ADCs, external switches, attenuators...
  •  Weighting
  •  Decimation
  •  Data logging
  •  History buffer
  •  Dual-rate FFTs
  •  Dual channel mode, multi-channel
  •  Calibration and scaling for different display units (watts, volts, current et cetera)
  •  Two-port measurements (impedance, combining of channels in frequency domain, crosstalk ...)
  •  Spectra triggers
  •  Overlay storage (save and recall waveforms)
  •  Scripted measurements - stepping, logging etc, for total characterization of DUT.
  •  WEB UI